A part of the chapter dedicated to troubleshooting in “Getting Started with FortiGate” is available here for free
http://www.packtpub.com/article/troubleshooting-fortigate
Base system diagnostics
The status screen in the web-based manager includes a high level overview of information such as the system time (that is important, for example, to have coherent error messages and log recording), CPU and memory usage, license information, and alerts, as we can see in the following screenshot:
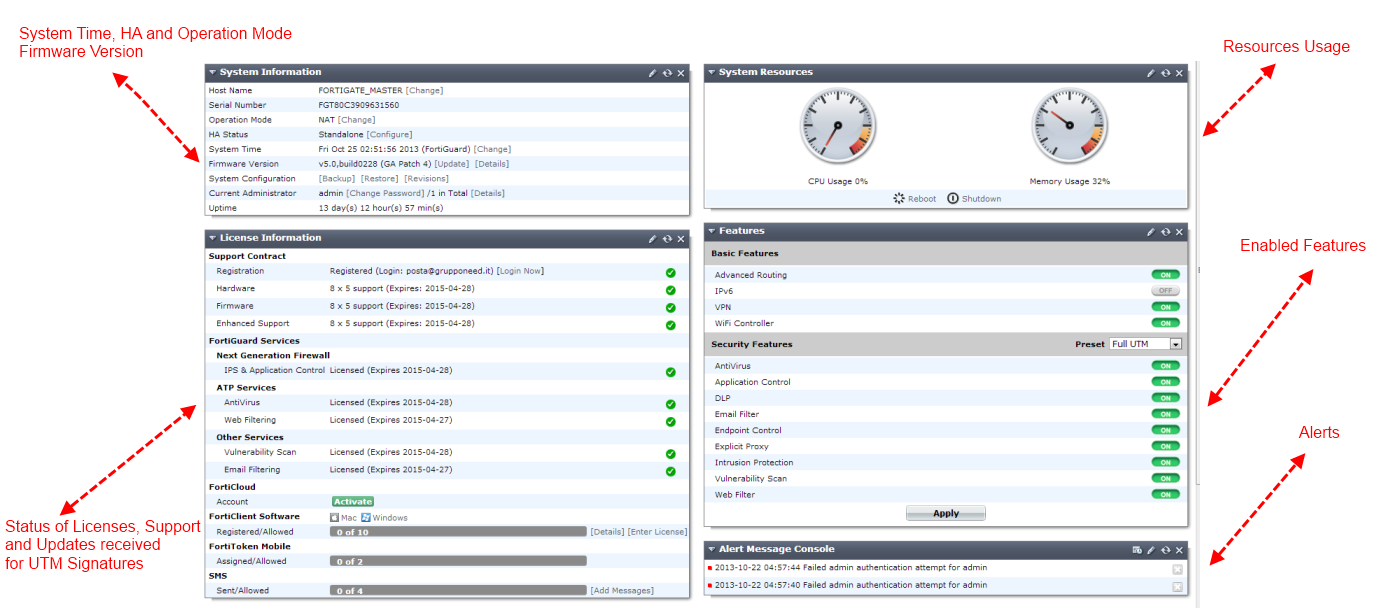
Although this screen is useful for a rapid assessment of the situation, our diagnostic tools usually have to dig deeper. The first base command we will use in the CLI is get system. This command can open more than eighty information options, dedicated to the different features of the FortiGate units. Among the others, we are able to check counters related to performance, such as:
- Startup configuration errors with the get system startup-error-log command.
- Firewall traffic statistics related to the traffic with the get system performance firewall statistics command
- Firewall packet distribution statistics with the get system performance firewall packet-distribution command
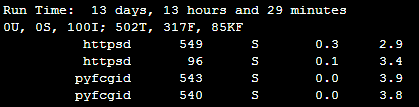
- Information about the most intensive CPU processes with the get system performance top, that will show a screen divided in columns, as we can see in the following screenshot:
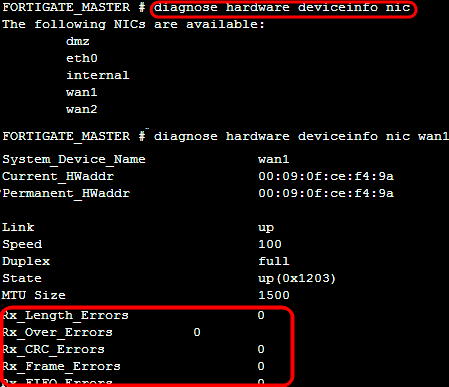
Another fundamental command we will use is diagnose hardware, which is used for problem-solving procedures related to certificates, devices, PCI, and system information. The devices menu is opened with the diagnose hardware deviceinfo, and includes a disk option to recover information about internal disks (if present) and a nic option to display data from network interfaces. The latter also shows on screen the errors and the drops related to network packets, as we can see in the following screenshot:
To have access to real-time information, we will use the diagnose debug command. The diagnose debug report is not a troubleshooting tool, but is used to create a report for the Fortinet technical support. We will talk about additional options for the diagnose debug command later, in relation to TCP/IP debugging.
Troubleshooting routing
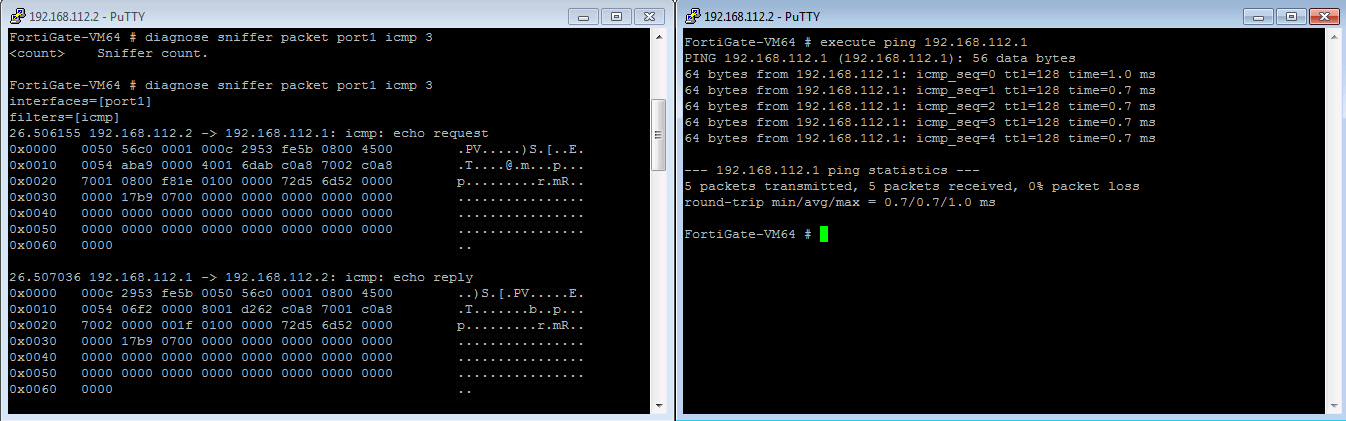
The tools that we will see in the following paragraphs will be required to troubleshoot the addressing and routing features of the TCP/IP protocol. Before we proceed to explain the single tools and commands for troubleshooting, we can take advantage of a real-world suggestion. In order to perform the troubleshooting steps in a more comfortable way, it is often advisable to use a client for SSH and Telnet such as PuTTY (http://bit.ly/1kyS98), to launch two separate sessions on a FortiGate unit. One of the two consoles will be dedicated to watch the results of the debug commands. The second console will be dedicated to launch commands, such as ping and traceroute that we will use to trigger actions that will be visible in the first open console. In the following screenshot we have a diagnose sniffer packet port1 icmp command running on the session opened to the left-hand side and an execute ping command on the session opened on the right-hand side window:
Layer 2 and layer 3 TCP/IP diagnostics
Some issues can be solved only by correcting the ARP table that associates IP and MAC addresses. Thediagnose ip arp list command shows the ARP cache as shown in the following screenshot:

The following commands are used to manage the ARP cache:
- The execute clear system arp table command to remove the ARP cache.
- The diagnose ip arp delete <interface name> <IP address> command to remove a single ARP entry.
- The diagnose ip arp flush <interface name> command to remove all entries associated with a single interface.
- The config system arp-table command to add a static ARP entry. This command requires two further commands:
- The config system arp-table command
- The edit command to create a new entry and to modify an existing entry or to create a new one
- Three mandatory parameters are:
- set mac, to configure a MAC address for the entry
- set ip, to configure an IP address for the entry
- set interface, to select the interface that is connected to the MAC and IP
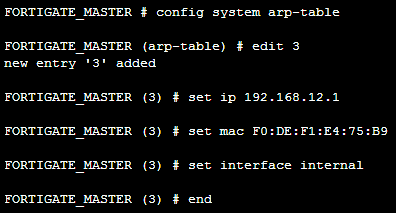
In the following screenshot we can see all the required steps to add the entry number 3 on our ARP cache with the following parameters: ip 192.168.12.1 with a mac F0:DE:F1:E4:75:B9 on the internal interface:
The use of a static ARP entry can be useful, for example, to resolve and prevent problems such as ARP poisoning. For more information you can read the article from Corey Nachreiner : Anatomy of an ARP Poisoning Attack available athttp://www.watchguard.com/infocenter/editorial/135324.asp.
We can now take care of layer 3, especially from the point of view of routing. As in any device that manages networking, the most used command (included in the ICMP protocol) is the ping command. A FortiGate unit supports two kinds of ping commands: execute ping <IP address> and a command dedicated to modify the behavior of the ping command, execute ping-options, that includes parameters such as:
- data-size: To select the datagram size in bytes (between 0 and 65507)
- interval: To set a value in seconds between two pings
- repeat-count: To select the number of pings to send
- source: To specify a source interface (default value is auto-select)
- view-settings: Used to show the current ping options
- timeout: To specify time out in seconds
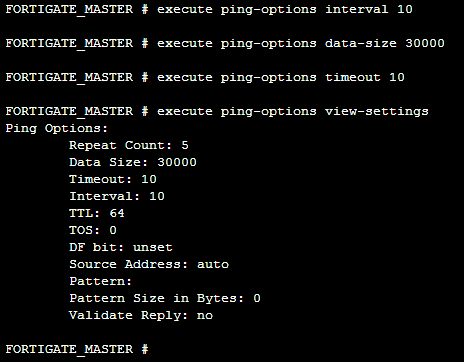
In the following screenshot we have modified some ping parameters and verified them with the view-settings parameter:
Another fundamental command, based on ICMP is execute traceroute <dest>, that allows us to see all the hops (networking devices) that a network packet traverses, starting from the FortiGate to a destination (which can be an IP address or an FQDN). Having the full path shown can be important to detect a wrong or faulty hop along the path. The usefulness of traceroute is related to how many devices along the route allow the use of the ICMP protocol, but also if we use it only inside to troubleshoot our internal corporate network, the results of this simple command are extremely useful. To show the result of a traceroute and have fun along the way, we can use the so called “Star Wars Traceroute”; execute traceroute 216.81.59.173, that will show the opening crawl to Star Wars Episode IV (a result that was obtained making clever use of hostnames and routing). We can see a (small) part of the result in the following screenshot:

The next logical step to debug problems at layer 3 of TCP/IP is to verify the routing table, something that we are able to do with the get router info routing-table all command. The resulting information text could be very lengthy, so we are able to filter the output using the parameters including:
- details: Show routing table details information
- rip: Show RIP routing table
- ospf: Show OSPF routing table
- isis: Show ISIS routing table
- static: Show static routing table
- connected: Show connected routing table
- database: Show routing information base
The routing table shows the routing entries and their origin (the routing protocol that added an entry in the routing table).
Summary
In this article, the authors have made the understanding of the Base system diagnostics, the troubleshooting of routing, and layer 2 and layer 3 TCP/IP diagnostics better.