Microsoft has announced something at RSA 2026 that deserves more attention than it has received so far: a brand-new report inside the Microsoft Defender portal called the Protection and Posture Insights report.
If you manage Microsoft 365 security for an organisation, this one matters, and here’s why.
What Is It?
The Protection and Posture Insights report is a dedicated view inside the Defender portal that gives you a personalized, tenant-specific picture of the threats being directed at your environment and how Defender is responding to them.
This is different from the generic threat dashboards and email protection status reports that have existed for a while. Those tell you what Defender caught across broad categories. This report tells you what was happening specifically in your tenant which campaigns were targeting your users, which techniques were being used, who was in the firing line, and where your risk is concentrated.
Built entirely on your own telemetry, there’s no averaging across a generic baseline. The data is yours.
What’s Actually Inside It?
Having had the chance to look at the report for a live tenant, here’s how it’s structured and what each section genuinely delivers.
Executive Summary
A high-level overview of the period: how many threats were observed, how they were handled, and what the overall protection picture looks like. Designed to be readable by someone who doesn’t live in the Defender portal day-to-day.
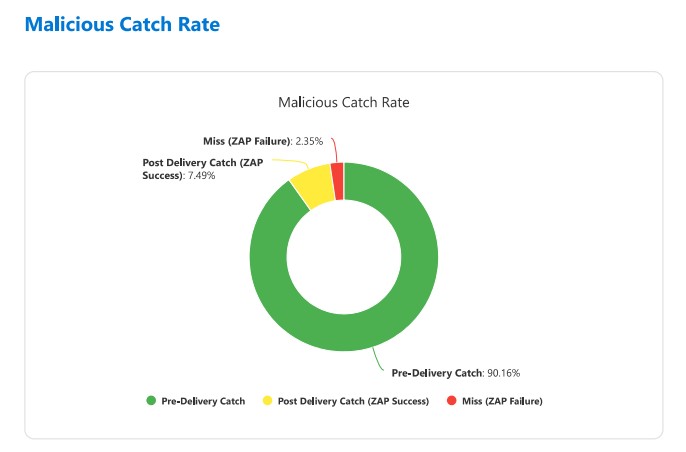
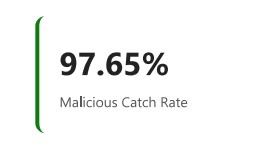
Effectiveness
This section answers the headline question: how well is Defender actually performing for this tenant? It breaks down what was caught versus what reached users, giving you a defensible answer to “is this working?” rather than just a volume count.
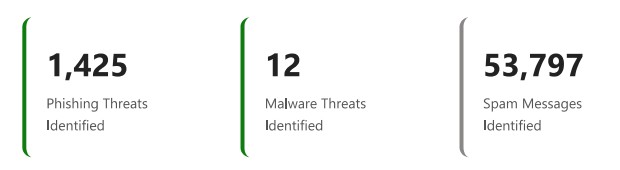
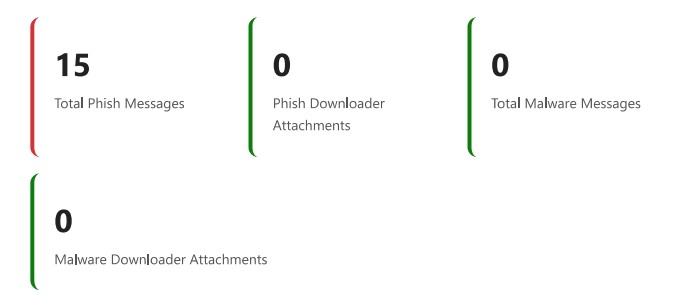
Threat Landscape & Threat Classification
A breakdown of the threat types observed during the reporting period — spam, phishing, malware — with classification detail. This is where you start to understand the character of attacks hitting your organisation, not just the numbers.
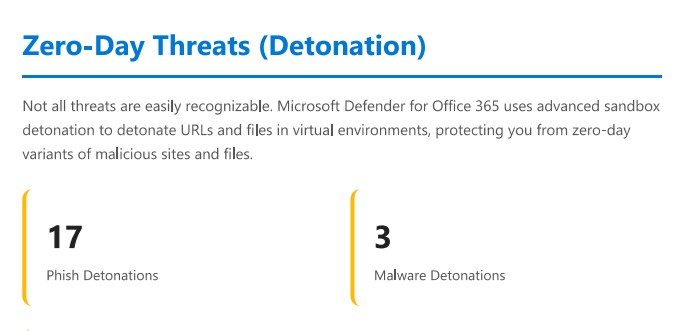
Zero-Day Threats (Detonation)
One of the more technically interesting sections. This covers threats that were caught specifically via Safe Attachments detonation analysis, i.e., files or URLs where Defender had no prior signal and had to run them in a sandboxed environment to determine they were malicious. The presence of this section in the report gives you visibility into how much of your protection depends on that detonation layer versus signature-based detection.
Priority Accounts
If you’ve configured Priority Accounts in Defender (executives, finance, IT admins), this section shows you whether they are being targeted at a higher rate than the general user population, and how those threats were handled. This is a useful data point for board-level conversations about targeted risk.
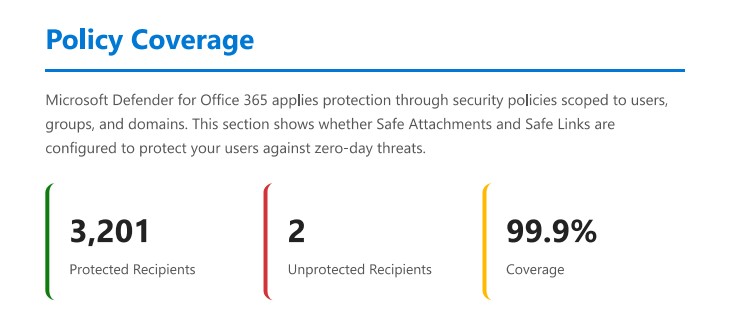
Policy Coverage
This is arguably the most operationally useful section for an administrator. It maps your current policy configuration against the threats that were observed, surfacing any coverage gaps. If a threat type is hitting your organisation but you don’t have the relevant policy configured to catch it optimally, this is where that shows up.
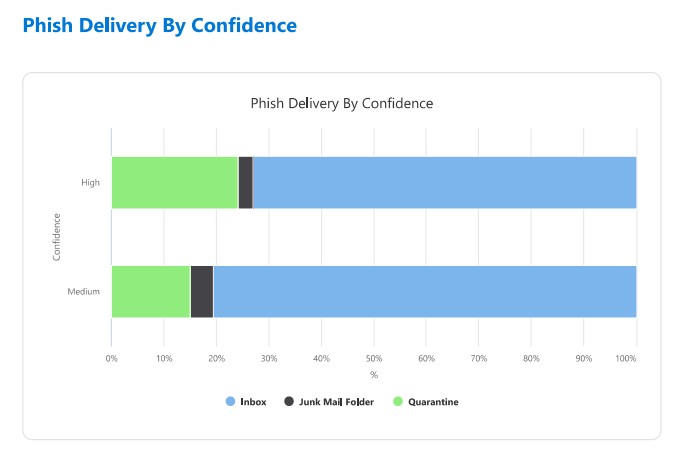
Delivery Locations
Where did threats end up? Inbox, junk, quarantine, blocked pre-delivery? This section shows the distribution across delivery outcomes, which helps you understand whether your policies are catching threats early or whether too much is reaching users before being remediated.
Detection Trends & Inbound Detection Technology
Trend data over the reporting period, and a breakdown of which detection technologies fired — things like URL detonation, file reputation, anti-spoofing, impersonation protection, and so on. Useful for understanding which parts of the stack are doing the heavy lifting.
Phish Threshold Policy Level
Your current anti-phishing threshold setting shown in context of the threats observed. If your threshold is set conservatively relative to what’s hitting your users, this section makes that visible — without you having to cross-reference documentation and policy settings manually.
Quarantine Statistics
A summary of what ended up in quarantine over the period, including volumes and categories. Useful both for operational awareness and for reviewing whether your quarantine policies are set appropriately.
Why This Matters
Most Defender reporting up to now has been good at answering volume questions: how many phishing emails were blocked this month, how many malware attachments were quarantined. What it hasn’t done well is answer posture questions: are we configured correctly for the threats we’re actually seeing? Are there gaps between what’s hitting us and what we’re catching?
The Protection and Posture Insights report shifts the frame. Instead of a count of events, you get a narrative about your environment: what attackers are trying, how your controls are performing against those specific attempts, and where the gaps are.
The Policy Coverage and Phish Threshold sections in particular are genuinely new value. These are questions that previously required an admin to manually compare their configuration against observed threat patterns. Having that surfaced in a single report (and tied to your actual telemetry rather than a generic recommendation baseline) is a meaningful step forward.
For organisations running Defender for Office 365 Plan 2 or Defender XDR, this is worth checking as soon as it appears in your portal.
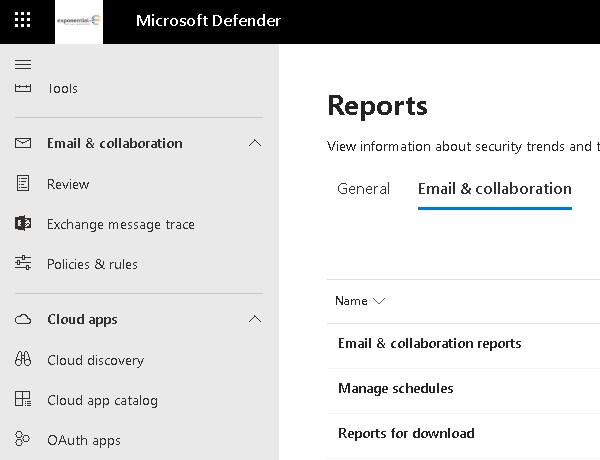
Where to Find It
The report is accessible directly in the Microsoft Defender portal (security.microsoft.com). Head to Reports and look for Protection and Posture Insights under the Email & Collaboration / Email & Collaboration reports. It is being rolled out following the RSA 2026 announcement in late March, so if you don’t see it yet, it should appear in your tenant shortly.
The report covers a rolling period and is exportable as a PDF, which makes it practical to include in regular security reviews or customer reporting without manual assembly.
A Note on Licence Coverage
Full access to this report requires Defender for Office 365 Plan 1 or Plan 2, or a Defender XDR licence. Organisations on baseline Exchange Online Protection will have limited visibility.
If you’re assessing whether to move customers up to MDO Plan 2, the combination of this report and the broader investigation and hunting capabilities it supports makes a stronger case than it did six months ago.
The Bigger Picture
This report landed alongside two other Teams-focused announcements at RSA 2026: inline real-time warnings for vishing (Teams call impersonation), and SOC-level call investigation capabilities including advanced hunting on call events. Microsoft is making a deliberate push to bring Teams calling up to parity with email as a first-class security signal.
The Protection and Posture Insights report sits across all of that — a single place to understand what’s hitting your collaboration surface and whether your posture is right for it.